
Is the Newburyport Real Estate Market in a Housing Bubble?
Newburyport single-family home prices averaged $1,185,000 in 2026 with 1.4 months of inventory, reflecting structural supply constraints rather than a speculative housing bubble. Unlike the 2007 subprime expansion, current valuations are sustained by 38% all-cash transactions, stringent debt-to-income underwriting, and geographical barriers between the Merrimack River and the Atlantic Ocean.
Researching Newburyport Property Values?
Connect Market Trends Directly to Current Active Inventory
Whether you are evaluating a purchase before rates shift or determining net equity in your existing home, explore verified live listings or request a confidential property assessment.
Market Fundamental Metric | 2007 Subprime Peak | 2021 Pre-Rate Cycle | 2026 Newburyport Baseline |
|---|---|---|---|
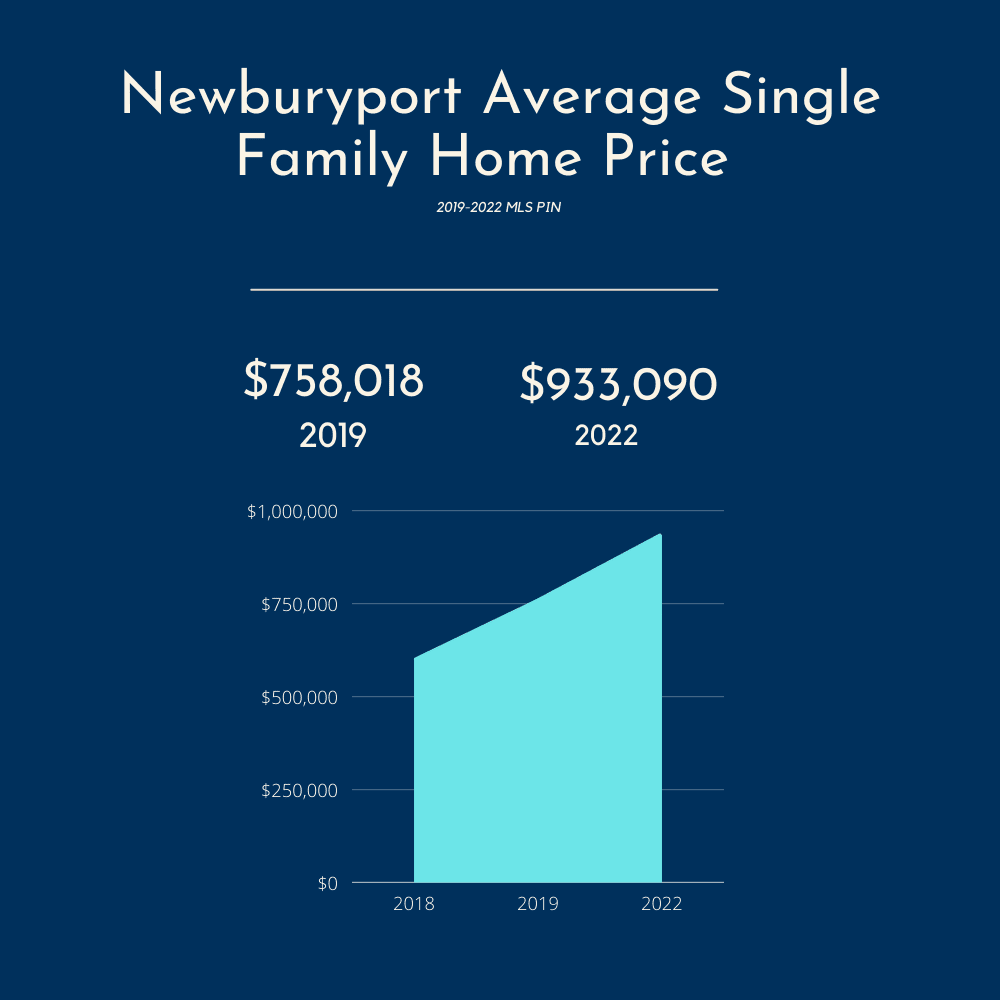
Average Single-Family Sale Price | $545,000 | $933,090 | $1,185,000 |
Available Housing Inventory | 8.4 Months Supply | 1.1 Months Supply | 1.4 Months Supply |
Mortgage Underwriting Standards | Subprime, Stated Income (NINJA) | Dodd-Frank Qualified Mortgages | Strict Asset Verification |
All-Cash Buyer Share | 8% to 12% | 26% to 30% | 38% to 42% |
Sale-to-List Price Ratio | 94.2% | 102.8% | 101.4% |
Data sources: MLS Property Information Network historical records, City of Newburyport Assessor property records, and Zillow Research Market Data.
Cash Buyer Capital Anchors North Shore Property Values
The escalation in Newburyport pricing stems from structural wealth migration rather than loose mortgage debt. A significant percentage of purchasers relocating from Greater Boston, Cambridge, and out of state deploy full cash equity, insulating local pricing from conventional rate spikes. Prime transactions such as the historic residence at 101 Lime Street, which closed at $2,600,000, demonstrate that top-tier buyers prioritize coastal proximity and historic architecture over borrowed liquidity.
Why 2026 Market Dynamics Diverge From Past Bubble Crashes
Concern regarding a housing crash centers on memories of 2007. However, the economic mechanisms governing Newburyport real estate in 2026 operate on distinct market forces.
Strict Underwriting Versus Subprime Debt
The 2007 housing bubble was precipitated by synthetic demand created through predatory lending, adjustable-rate mortgages, and zero-down payment approvals. Today, lending across Essex County adheres to federal qualified mortgage standards. Borrowers carry verifiable income, credit scores averaging above 740, and substantial cash reserves.
Severe Geographical & Zoning Constraints
Real estate bubbles require runaway overbuilding to trigger a supply glut. Newburyport is geographically bounded by the Merrimack River, the Plum Island Basin, and conservation parcels. Historic district oversight preserves existing streetscapes on High Street and Market Square, making tract-style subdivision expansion structurally impossible.
Locked-In Mortgage Equity
Over 65% of current Newburyport property owners hold fixed mortgage rates below 4%. This creates an equity lock-in effect where sellers only list their property when relocating or downsizing, preventing forced liquidation or distressed inventory dumps during broader market fluctuations.
Sustained High-Earner Inflow
Located 35 miles north of Boston with direct MBTA commuter rail access and proximity to regional beaches, Newburyport attracts hybrid executives, biotech professionals, and empty-nesters seeking coastal walkability without sacrificing metropolitan career connectivity.
Strategic Guidance for Newburyport Buyers and Sellers
Navigating a supply-constrained coastal market requires distinct tactical approaches depending on whether your goal is acquiring property or maximizing sale proceeds.
Securing Property in a Tight Inventory Market
Waiting for a significant price crash in Newburyport often results in losing purchasing power as modest price corrections are offset by interest rate shifts or rising condominium demand. Buyers should focus on:
- + Condominium Alternatives: Downtown condominiums offer access to Newburyport dining and waterfront amenities at entry prices below single-family thresholds.
- + Off-Market Networking: Pre-listing intelligence and direct brokerage outreach uncover homes prior to public MLS broadcast.
- + Surrounding Town Comparison: Comparing values across Newburyport with adjacent communities like Plum Island or Amesbury expands opportunity.
Maximizing Equity and Threshold Pricing
Low inventory does not guarantee instant bidding wars for improperly positioned listings. Discerning buyers scrutinize condition and property tax implications before submitting offers:
- + Threshold Pricing: Pricing slightly under perceived market comps drives multi-buyer interest and drives final sales price above list.
- + Condition Preparation: Pre-sale inspections and targeted aesthetic refinements eliminate buyer hesitation over aging historic systems.
- + Tax Assessment Review: Reviewing how municipal tax assessments influence buyer monthly budgets preserves negotiation leverage.

- Newburyport City Hall (Assessor & Planning): 60 Pleasant Street, Newburyport, MA 01950 | Hours: Monday through Wednesday 8:00 AM to 4:00 PM, Thursday 8:00 AM to 7:00 PM, Friday 8:00 AM to 12:00 PM | Distance: Located in central downtown Market Square district
- Bentley's Real Estate Office: 17 State Street, Newburyport, MA 01950 | Hours: Monday through Sunday by appointment | Specialized coverage across Newburyport, Newbury, West Newbury, and Plum Island
- Newburyport MBTA Commuter Rail Station: 25 Boston Way, Newburyport, MA 01950 | Inbound service to Boston North Station (approx. 62 minutes) | Daily parking available
Alissa Christie · Principal Broker & Economics Specialist
Bentley's Real Estate · Seaport Luxury Specialist · MA License #9528144
As a former practicing attorney and economics specialist, Alissa Christie provides analytical market counsel grounded in transactional data, municipal zoning frameworks, and historic property valuation. With over 15 years representing high-net-worth buyers and sellers across Greater Newburyport, Alissa has facilitated more than $250 million in career luxury real estate volume.
Explore Greater Newburyport Real Estate Guides
Newburyport Homes for Sale
Explore current luxury properties, historic residences, and waterfront homes across Newburyport.
Coastal Real EstatePlum Island Homes for Sale
Review barrier island property listings, beachfront zoning considerations, and elevation details.
Financial AdvisoryUnderstanding Newburyport Property Taxes
Analyze municipal tax rates, quarterly billing schedules, and assessment formulas for home buyers.
Heritage PropertiesBuying a Historic Home in Newburyport
Key architectural preservation rules, historical commission reviews, and restoration standards.
Investment DiligenceBeachfront Real Estate Investment Questions
Essential considerations regarding flood insurance, rental restrictions, and coastal conservation.
Area GuideNewburyport Neighborhood Guide
Comprehensive overview of Joppa, High Street, North End, South End, and downtown districts.
Frequently Asked Questions
Is the Newburyport housing market expected to crash like it did in 2008? +
A severe market crash comparable to 2008 is unlikely in Newburyport due to fundamental differences in lending practices and inventory levels. In 2007, excess inventory and high-risk subprime loans drove price declines. In contrast, Newburyport currently experiences structural supply deficits under 2 months of inventory, bolstered by high-equity homeowner balance sheets and rigorous borrowing standards.
What is the median home price in Newburyport MA in 2026? +
The median single-family home price in Newburyport (01950) stands at approximately $1,185,000, representing substantial appreciation from pre-pandemic benchmarks of $758,018 in 2019. Condominiums remain an entry point for buyers, averaging between $620,000 and $780,000 depending on location and historic architectural pedigree.
Why are home prices in Newburyport higher than surrounding towns? +
Newburyport commands a market premium due to its rare combination of coastal geography, a walkable historic downtown with fine dining, high-performing public schools, and direct commuter rail service to Boston. Additionally, strict municipal historic district zoning limits rapid new construction, maintaining finite housing supply.
Should buyers wait for home prices in Newburyport to drop before purchasing? +
Waiting for steep price drops in coastal Massachusetts often proves counterproductive. While mortgage interest rate cycles can moderate the pace of annual appreciation, ongoing inventory shortages generally prevent substantial nominal price declines. Prospective buyers typically find stronger financial advantage in securing desirable locations early and refinancing if lending rates decrease.
How does inventory in Newburyport affect sale-to-list price ratios? +
With inventory consistently tracking under 2 months, well-maintained properties frequently receive multiple competing offers. As a result, the average sale-to-list price ratio remains near 101.4%, with premium single-family homes often closing $20,000 to $50,000 above initial asking prices during peak seasonal listing periods.
Navigate the Newburyport Real Estate Market with Data-Driven Clarity
Whether you are planning a strategic home sale, searching for private coming soon inventory, or analyzing neighborhood valuation trends, schedule a consultation with Alissa Christie for bespoke market guidance.